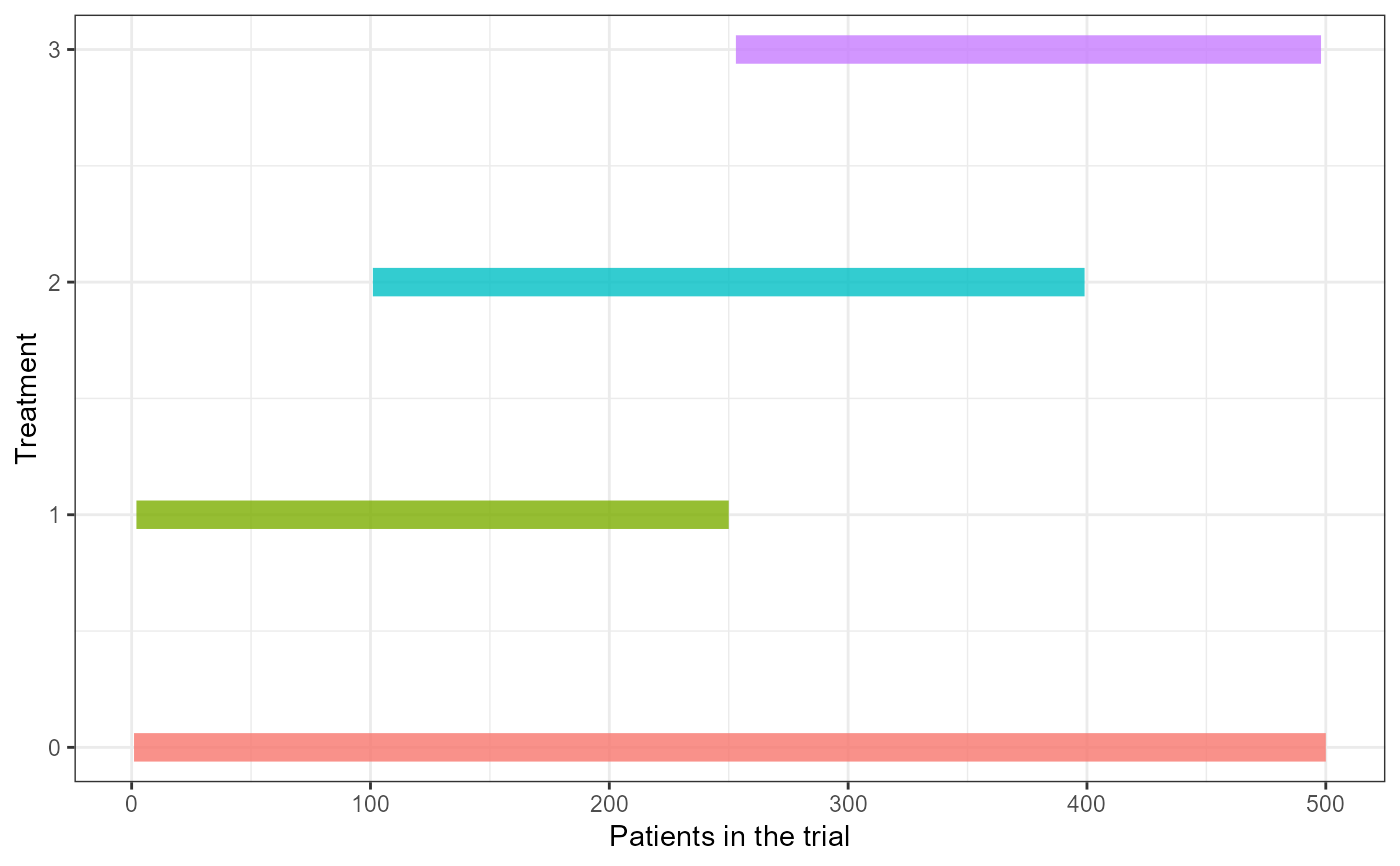
This function creates a plot visualizing the trial progress over time.
Arguments
- treatments
Vector with indices of assigned arms for each participant, ordered by time, e.g. column
treatmentfrom the dataframe resulting from thedatasim_bin()ordatasim_cont()function.
Examples
trial_data <- datasim_bin(num_arms = 3, n_arm = 100, d = c(0, 100, 250),
p0 = 0.7, OR = rep(1.8, 3), lambda = rep(0.15, 4), trend="stepwise")

plot_trial(treatments = trial_data$treatment)